- Subscribe to RSS Feed
- Mark Topic as New
- Mark Topic as Read
- Float this Topic for Current User
- Bookmark
- Subscribe
- Mute
- Printer Friendly Page
z-values on 3d graph
Solved!01-31-2013 10:08 AM - edited 01-31-2013 10:15 AM
- Mark as New
- Bookmark
- Subscribe
- Mute
- Subscribe to RSS Feed
- Permalink
- Report to a Moderator

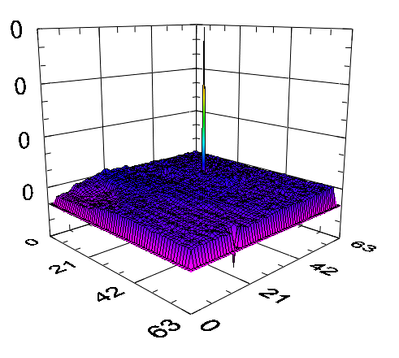
I was wondering what can I do to make the z-axis have values visible. The video is running OK but there are no values showing up
on the z-axis, only these zeros. Also the same happens on an intensity graph connected to it. I would appreciate your help. Thanks!
Solved! Go to Solution.
01-31-2013 11:53 AM
- Mark as New
- Bookmark
- Subscribe
- Mute
- Subscribe to RSS Feed
- Permalink
- Report to a Moderator
What does this have to do with Multifunction DAQ? What video are you talking about? You need to provide some details besides a picture.
02-01-2013 07:15 AM
- Mark as New
- Bookmark
- Subscribe
- Mute
- Subscribe to RSS Feed
- Permalink
- Report to a Moderator
Hi LambdaDigamma,
Are you sure that the Z-Axis values are not being rounded due to displaying as a lower precision - ie 0.02 being rounded to 0.
If you right-click on the graph display and click on "3D Graph Properties", you can then navigat to the tab shown below and set the formatting options:
I hope this helps,
02-04-2013 11:54 AM
- Mark as New
- Bookmark
- Subscribe
- Mute
- Subscribe to RSS Feed
- Permalink
- Report to a Moderator
thanks! it worked. I changed the display to ''scientific'' and now I can get the mVolt range I want... any idea about how to smooth the surface of the curve? ( I mean reduce some noise) Anyway maybe I should put it in another cateogy
Cheers!
Lambda Digamma
02-04-2013 12:11 PM
- Mark as New
- Bookmark
- Subscribe
- Mute
- Subscribe to RSS Feed
- Permalink
- Report to a Moderator
Hi Lambda Digamma,
Glad to hear it!
There are many ways to accomplish that in LabVIEW, from built-in filtering functions to simply performing a moving average. If you post in the LabVIEW forum then you should find a lot of help there 🙂
Kind Regards,

