- Subscribe to RSS Feed
- Mark Topic as New
- Mark Topic as Read
- Float this Topic for Current User
- Bookmark
- Subscribe
- Mute
- Printer Friendly Page
Waveforms during co-simulation
03-27-2013 10:08 AM
- Mark as New
- Bookmark
- Subscribe
- Mute
- Subscribe to RSS Feed
- Permalink
- Report to a Moderator
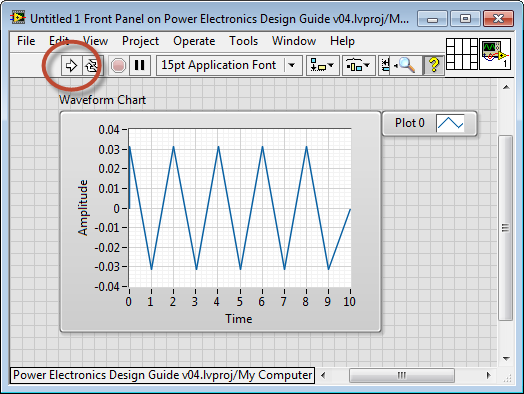
During co-simulation, I use waveform chart to show the simulation waveform. But I notice that it can only record part of the waveform. Now the waveform shown above is the waveform during the simulation. Why can't I see the waveform of previous time?
- Tags:
- cosimulation
04-02-2013 09:37 AM
- Mark as New
- Bookmark
- Subscribe
- Mute
- Subscribe to RSS Feed
- Permalink
- Report to a Moderator
Hi there,
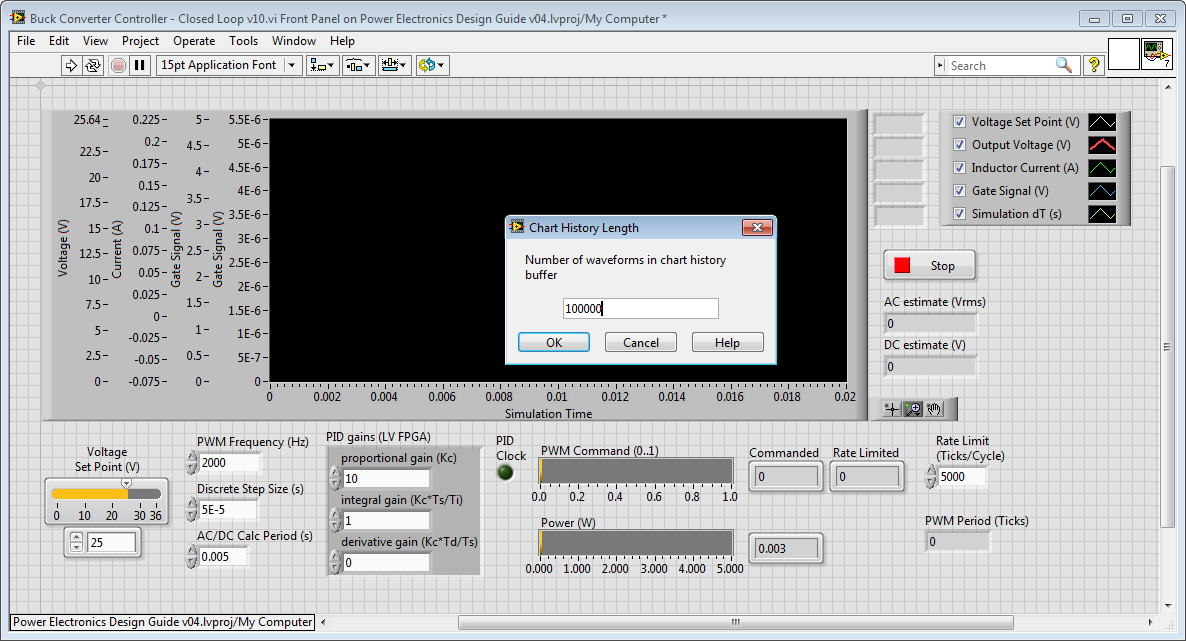
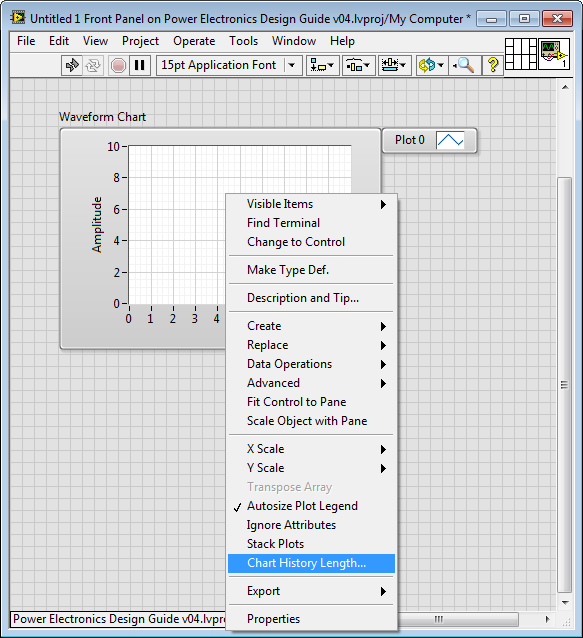
Good question. The LabVIEW waveform chart defaults to a tiny history length of 1024 or 8192, so right-click on the chart window and navigate to "Chart History Length...". Then set the history length to a larger value, such as 100,000, as shown below.
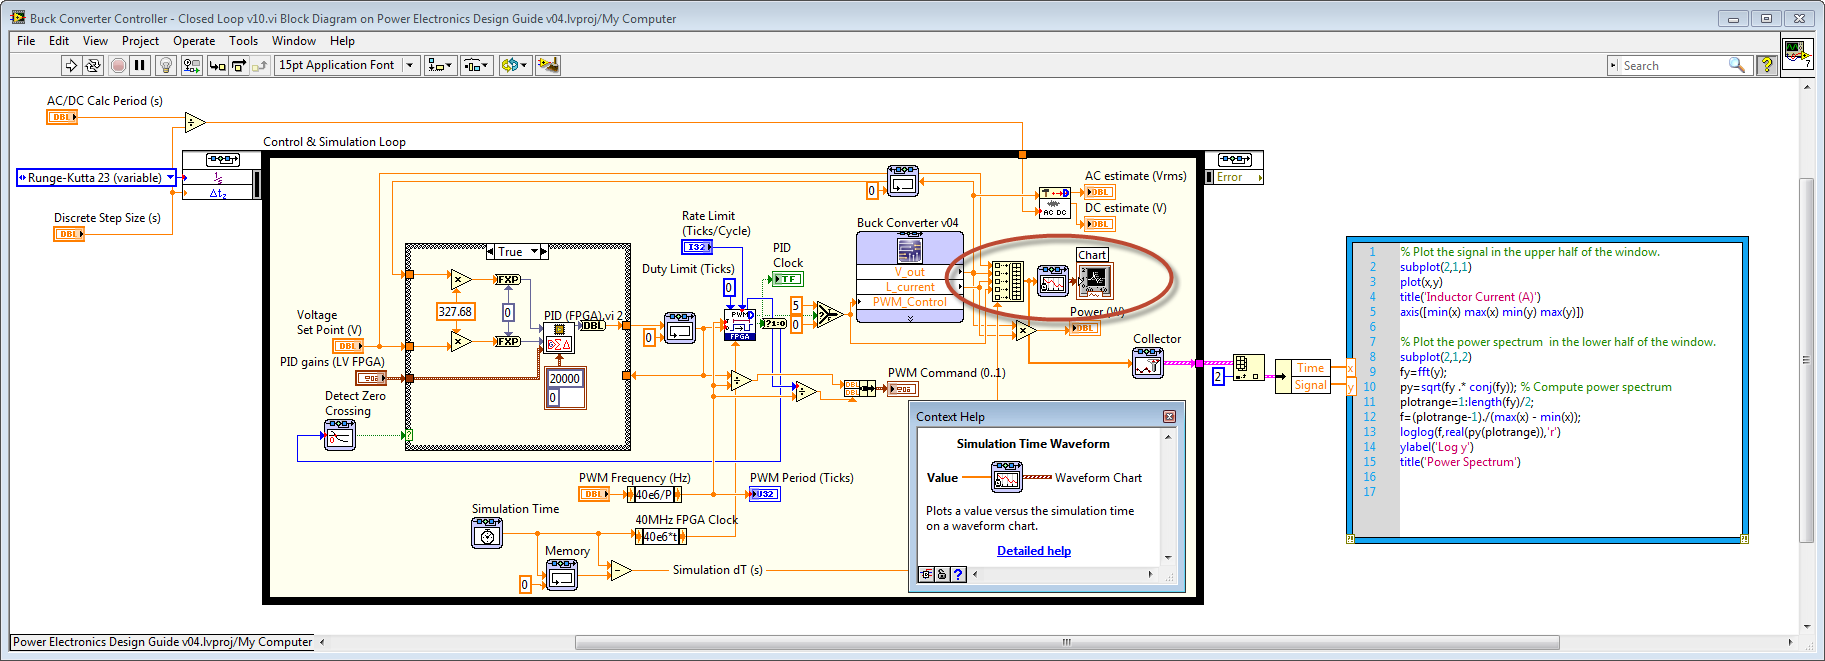
Also, make sure you are using the Simulation Time Waveform block to collect the data points for your chart inside the LabVIEW Control & Simulation loop. This block collects is needed when you run a variable timestep simulation (such as Runge-Kutta 23 (variable) shown below) so the chart only displays the datapoints for successfully completed timesteps, which are known as "major time steps" of the simulation.
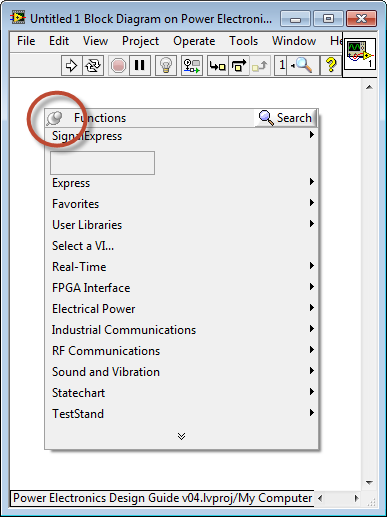
This function is located on the LabVIEW Control & Simulation Palette. To find it, you should first enable the display of that palette. To do that, open a new LabVIEW VI, right click on a white area of the block diagram and click on the thumb tack in the upper right corner of the palette.
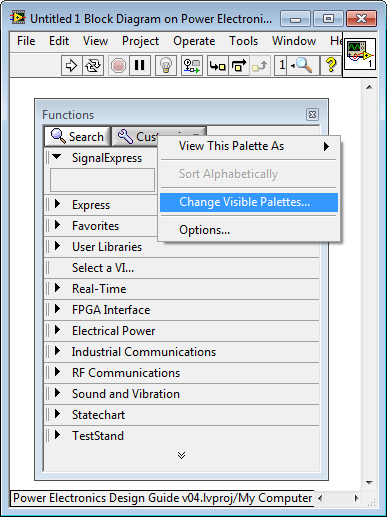
Next, click "Customize" and then "Change Visible Palettes..." as shown below.
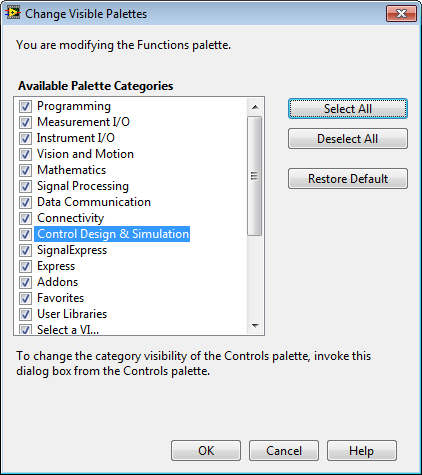
Check the box next to "Control Design & Simulation" or click "Select All" to enable the display of all palettes. Then click "OK".
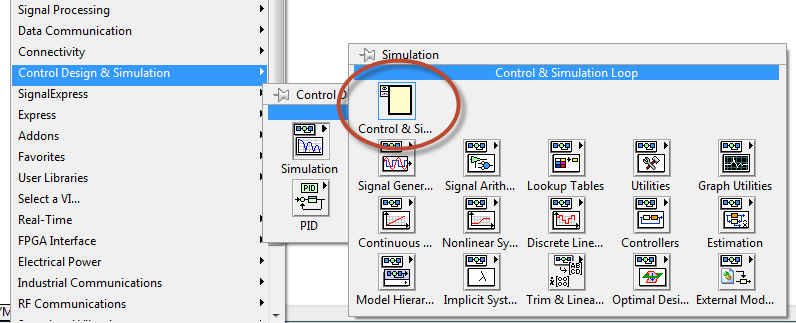
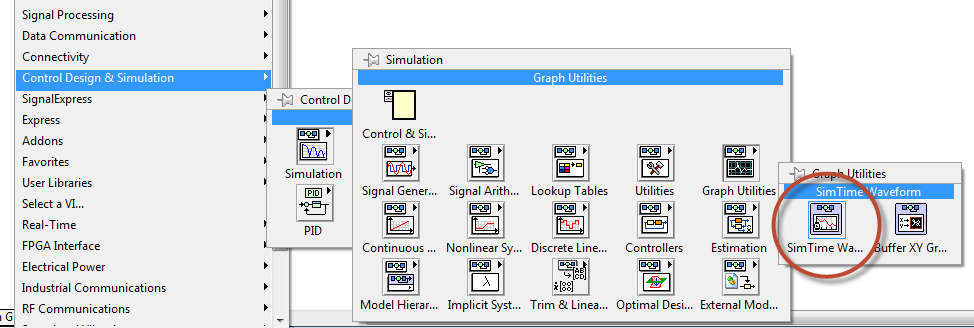
Okay, now right-click on the block diagram again and navigate to Control Design & Simulation>Simulation>Control & Simulation Loop, as shown below, and draw the Control & Simulation Loop on your block diagram.
Right-click inside the Control & Simulation loop and navigate to Graph Utilities>SimTime Waveform.
Then on the LabVIEW front panel, right-click on the chart and set the Chart History Length to a value such as 100,000.
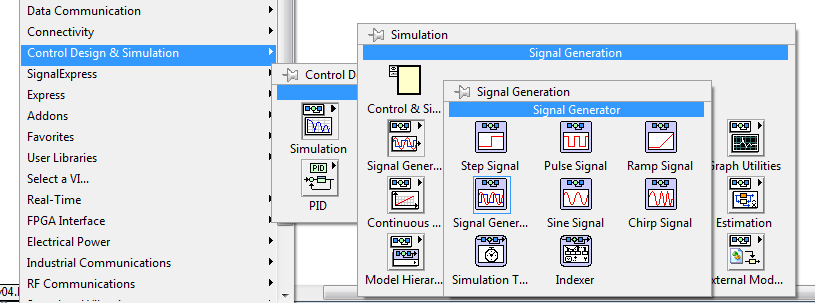
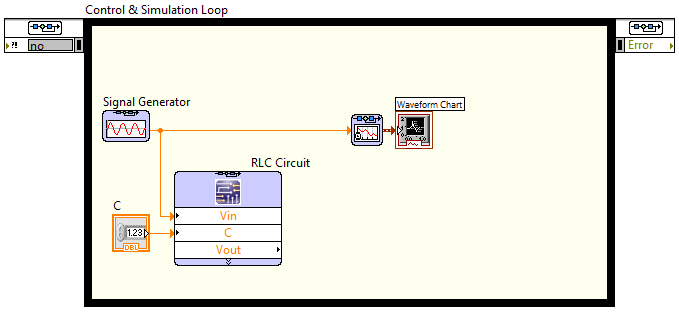
As a test, you may want to wire up a Signal Generator and run the simulation, as shown below.
First, drop down the Signal Generator.
Then wire it to the Simulation Time Waveform function.
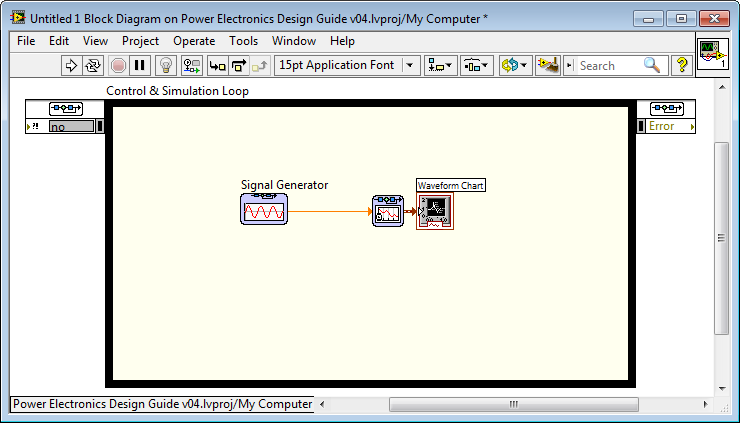
Then run the VI.
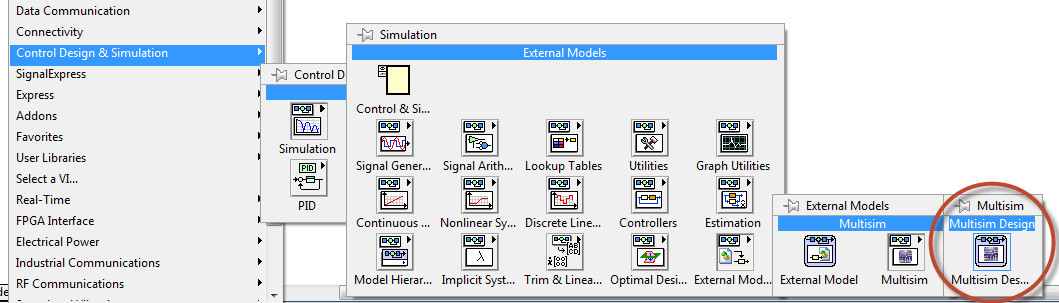
To add a Multisim Co-Simulation interface, drop down the block from the palette by right-clicking on the block diagram and navigating to Control Design & Simulation>Simulation>External Models>Multisim and then click on the Multisim Design block.
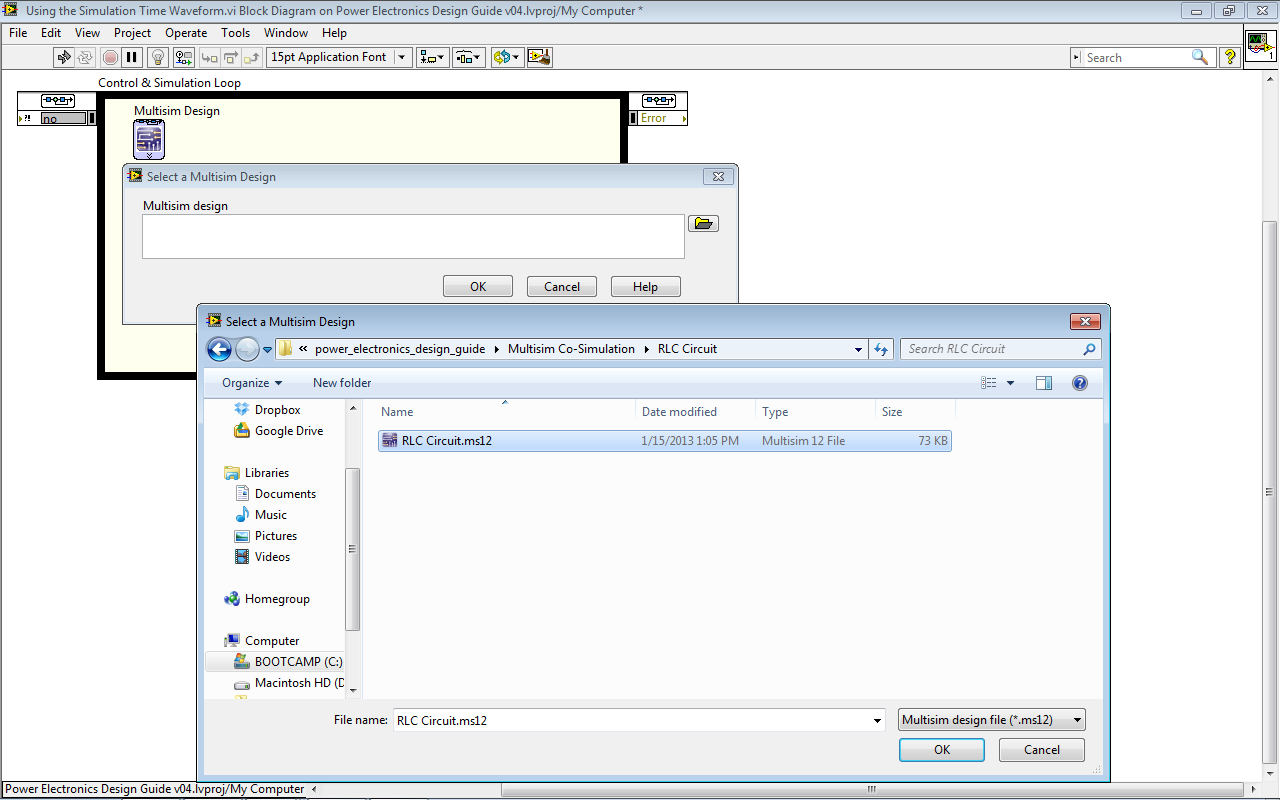
Now select the name of the Multisim schematic you want to co-simulate with. The RLC Circuit included in the NI Power Electronics Design Guide is a good one to start with.
Click on the arrows at the bottom of the co-simulation block to drag down and show the names of the signal inputs and outputs.
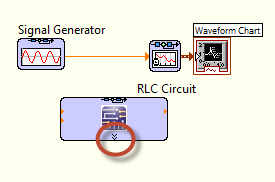
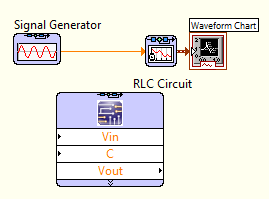
Now wire the Signal Generator waveform into Vin and right click on C to create a front panel control for the Capacitance value.
Next, right-click on the block-diagram and navigate to Programming>Array>Build Array.
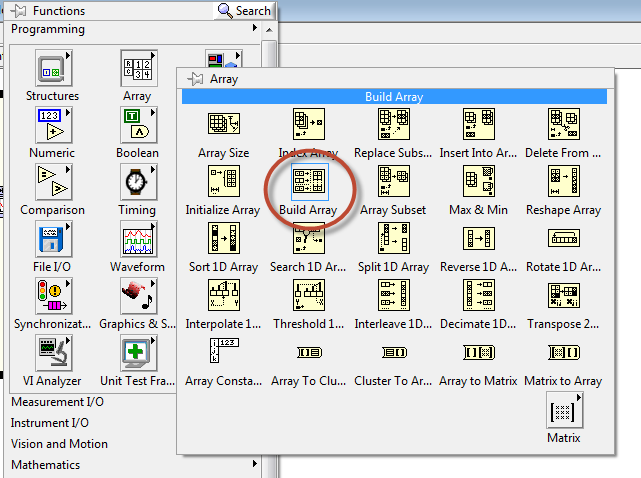
Drop down the Build Array function and wire in the signal generator waveform and the Vout waveform from the co-simulation node. Then wire the output to the Simulation Time Waveform block.
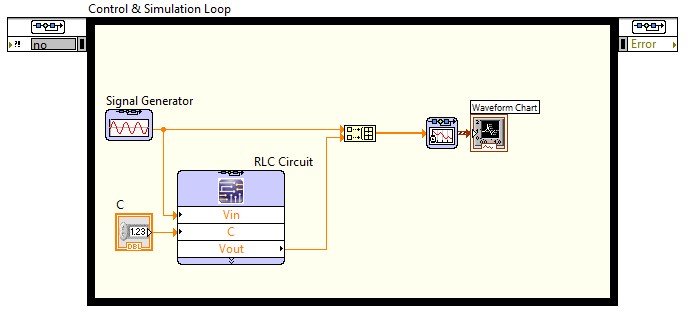
Set the Capacitance C value to 0.01 Farads and run the simulation.
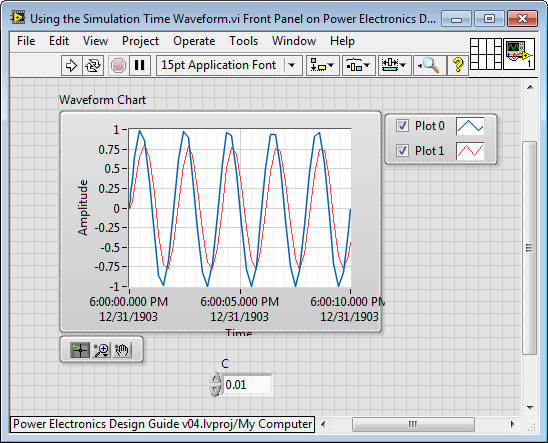
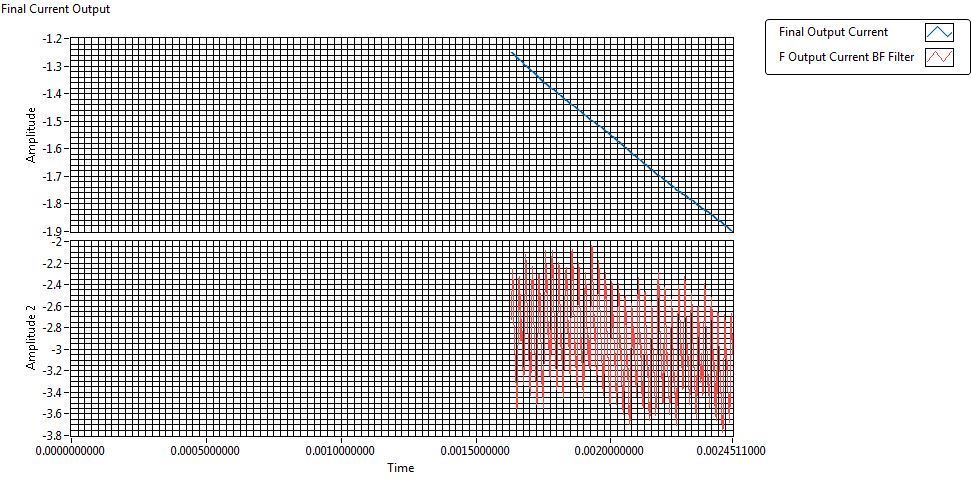
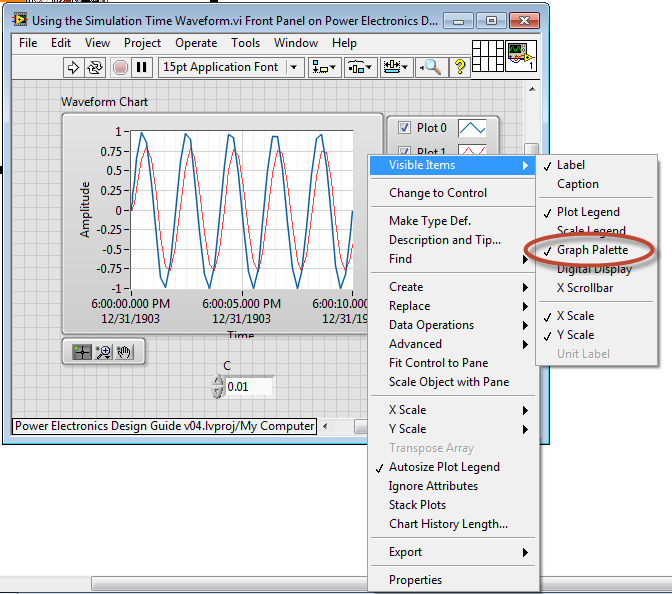
You may wish to right-click on the border of the chart and turn on the Graph Palette to enable zooming.
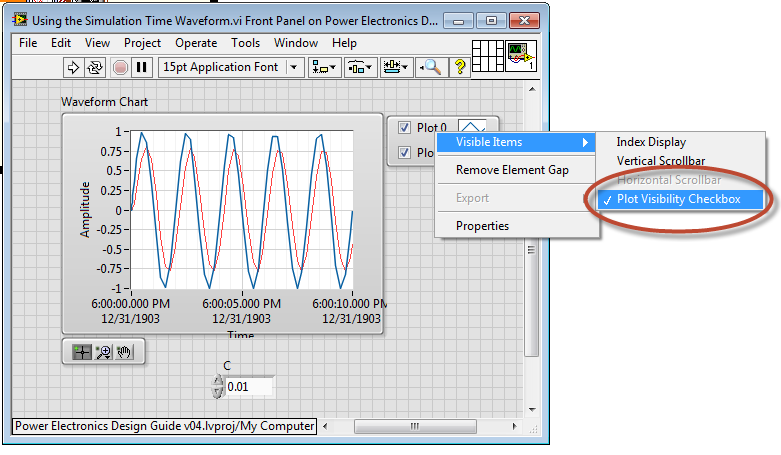
You may also want to right-click on the name of one of the plots and turn on the Plot Visibility Checkbox.
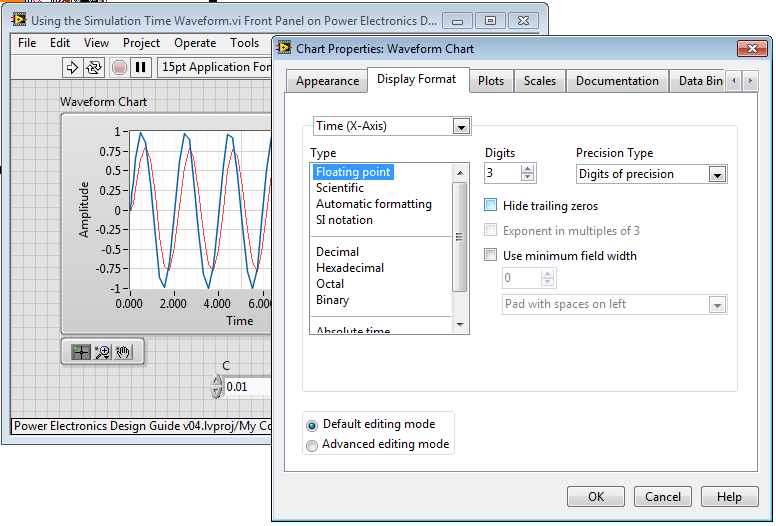
Also, you might want to right-click on the time axis, and change the "Formatting..." to floating point.