Turn on suggestions
Auto-suggest helps you quickly narrow down your search results by suggesting possible matches as you type.
Showing results for
Topic Options
- Subscribe to RSS Feed
- Mark Topic as New
- Mark Topic as Read
- Float this Topic for Current User
- Bookmark
- Subscribe
- Mute
- Printer Friendly Page
intensity graph
Member
02-24-2014 06:37 AM
Options
- Mark as New
- Bookmark
- Subscribe
- Mute
- Subscribe to RSS Feed
- Permalink
- Report to a Moderator
hello
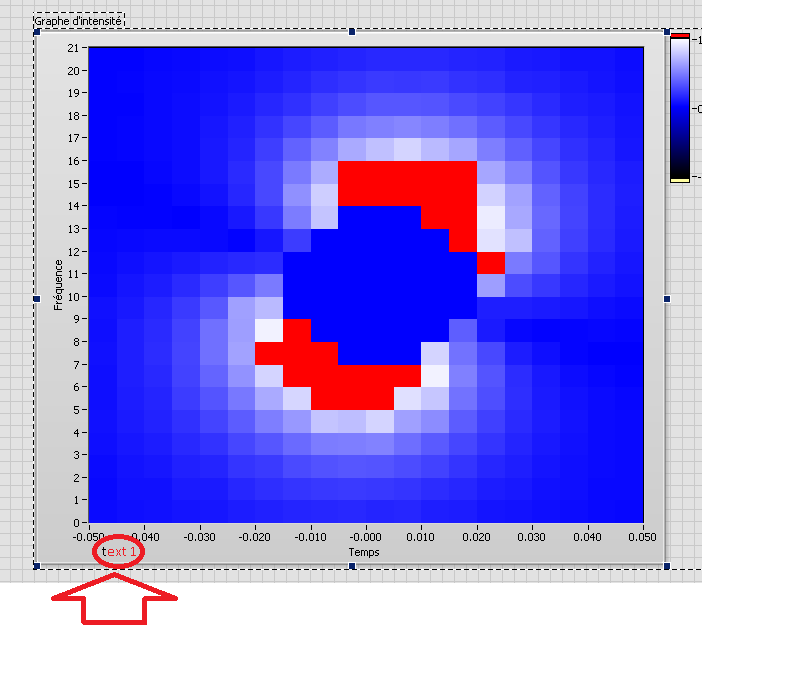
in a intensituy graph , I want place the scale text in the middle of the marker like excel
thanks a lot
Knight of NI
02-24-2014 06:52 AM
Options
- Mark as New
- Bookmark
- Subscribe
- Mute
- Subscribe to RSS Feed
- Permalink
- Report to a Moderator
Fake the scale by using a (transparent) string control!
I really do think such discussions (on programming issues) should be made in the LabVIEW forum…
Best regards,
GerdW


using LV2016/2019/2021 on Win10/11+cRIO, TestStand2016/2019
GerdW
using LV2016/2019/2021 on Win10/11+cRIO, TestStand2016/2019
02-24-2014 08:11 AM
Options
- Mark as New
- Bookmark
- Subscribe
- Mute
- Subscribe to RSS Feed
- Permalink
- Report to a Moderator
i' m sorry but i don't want fake the scale
i want put the marker in the middle of the scarre mesure like this
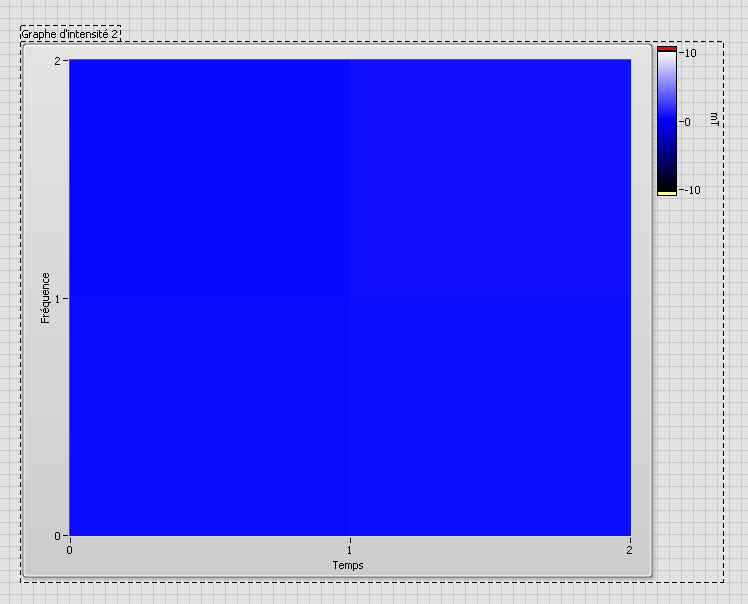
to
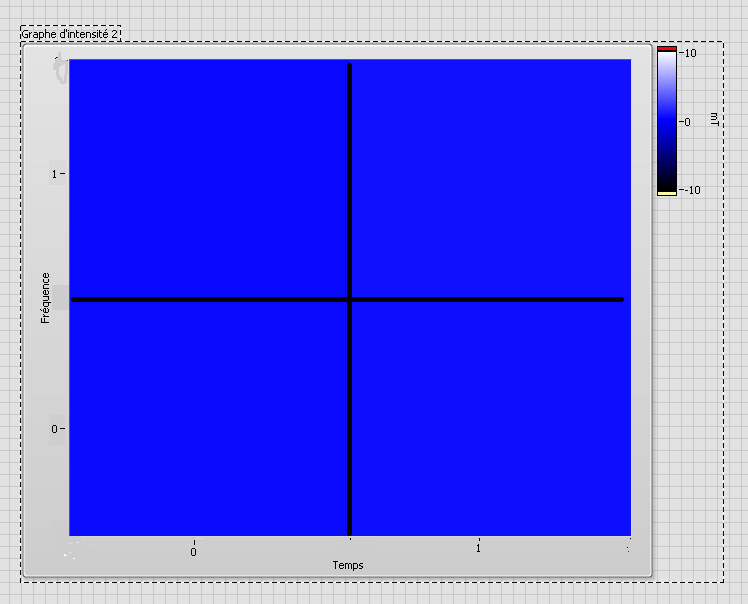
wathever the scale (2 or more).
thanks
Knight of NI
02-24-2014 09:26 AM
Options
- Mark as New
- Bookmark
- Subscribe
- Mute
- Subscribe to RSS Feed
- Permalink
- Report to a Moderator
Hi jerome,
you cannot put values in between the markers. That's a limitation of the current intensity graphs!
But I remember there was a related LabVIEW idea you can vote for! Please search on your own here!
Best regards,
GerdW
using LV2016/2019/2021 on Win10/11+cRIO, TestStand2016/2019
GerdW
using LV2016/2019/2021 on Win10/11+cRIO, TestStand2016/2019
