- Document History
- Subscribe to RSS Feed
- Mark as New
- Mark as Read
- Bookmark
- Subscribe
- Printer Friendly Page
- Report to a Moderator
- Subscribe to RSS Feed
- Mark as New
- Mark as Read
- Bookmark
- Subscribe
- Printer Friendly Page
- Report to a Moderator
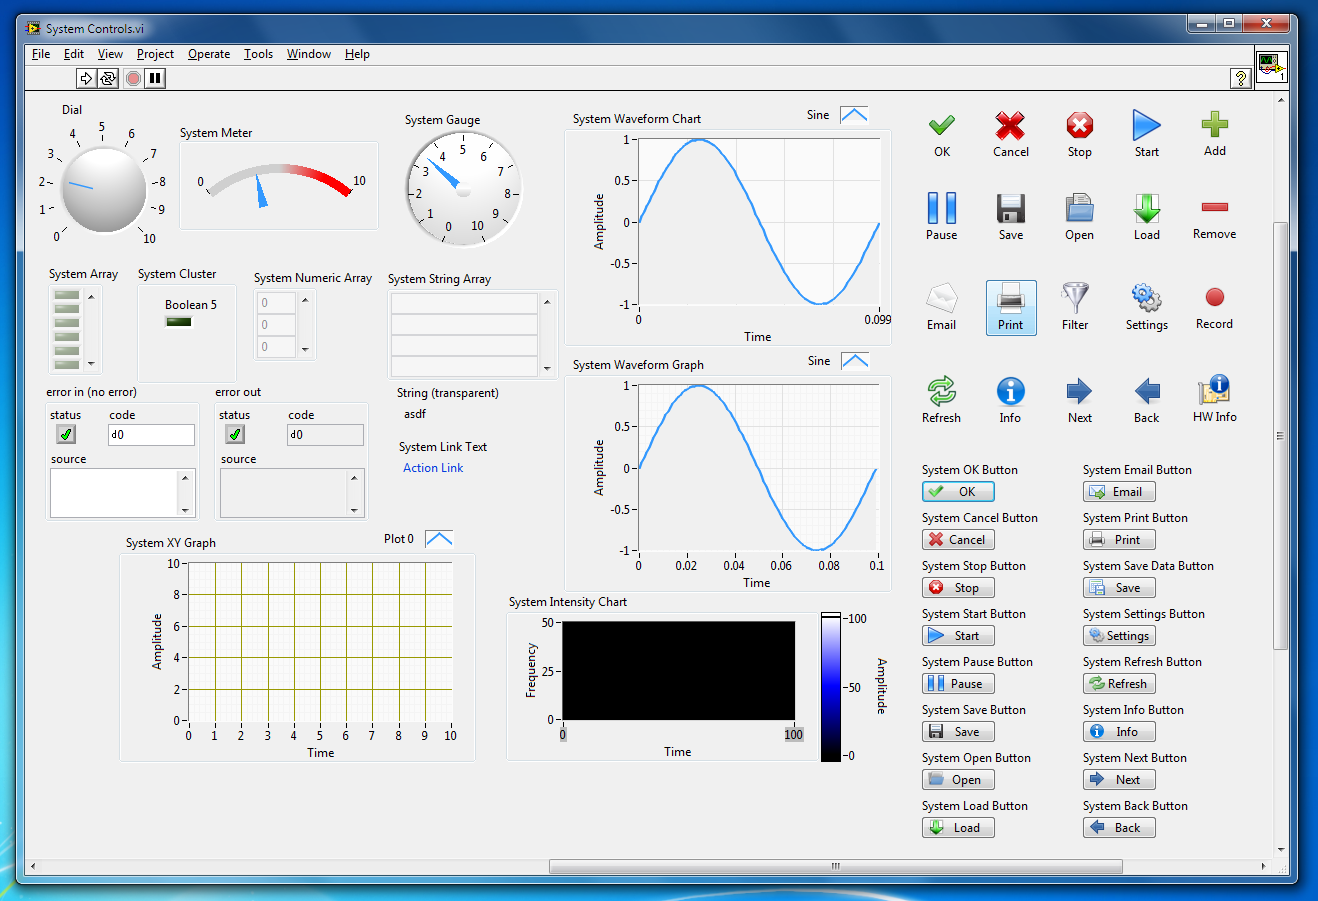
One of the first things I tell people who want to make "better" UIs in LabVIEW is to always use the System controls. System controls fit in well with the rest of the operating system and other programs that your user is familiar with. Good UIs help your user become comfortable faster. Familiarity breeds comfort etc. etc.
The one downside to this advice is that for some controls there is no System equivalent. There is no graph in the system palette since there is no defined graph control in Windows -- notice that system utilities such as Perfmon and Task Manager have visually different graphs. Clusters, arrays, error clusters, gauges etc. are other special LabVIEW control types that aren't common OS controls and as such aren't in the System palette.
Well, since the OS doesn't define how these controls should look, I decided to take a stab. Here is my effort to round out the System control palette with a number of the more specific LabVIEW controls customized to fit in well with the default OS controls (at least on Windows).
Credits:
- All the icons come from the Open Icon Library Project - http://openiconlibrary.sourceforge.net/
- I suppose I should credit Microsoft with the inspiration. For more design guidelines from MS I highly recommend reading their UX Guidelines found here - http://msdn.microsoft.com/en-us/library/aa511440.aspx
Installation Instructions:
Unzip the attached "Missing System Controls.zip" file in your <LabVIEW Install Directory>\menus\Controls\ folder and then restart LabVIEW to add all the above controls (and more) to your palette. Note: these controls were made in LabVIEW 2009.
or
Simply run the attached "Missing System Controls Installer.vi" -- this is a little experiment of mine. The VI contains all the .ctl file data stored as diagram constants and writes them to the appropriate files depending on which version of LabVIEW you select (currently only LV 2009 and the 2010 Beta would be supported since I wrote everything in LV 2009).
or
ni_ctl_system20-1.0.0-2.ogp contains the controls as a VI package installable with VI Package Manager.
Create Your Own Buttons!
If you like the iconized buttons and want more it's easy to create your own (although please share if you do create some). Grab some icons from the web (see link above) and watch this video to learn how:
[Note: The "Fake System Time Stamp.vi" is not part of this package - it's an experiment for someone in the Comment thread. Sorry if this is not the right place to attach it! - ChristinaR]
[Note: I added the "Missing System Graphs 1.vi" which attempts to update the "missing system style" graphs so their plot legends are not still in the Modern style. If I broke any of their functionality in the process, please let me know. - ChristinaR. Part 2: I added "Missing System Graphs 2.vi" which makes the Scale Format button on the Scale Legend a little bigger, to move the light off the decal]
[Note: I added "Missing System Array 1.vi" which has the index display changed to a system numeric. - ChristinaR]
[Note: I added "System Mixed Signal Graph.ctl" which is an attempt at a system-style mixed signal graph. - ChristinaR]
Software License
The code referenced in this document is distributed under the NATIONAL INSTRUMENTS SOFTWARE LICENSE TERMS (Sample Code License) - http://ni.com/samplecodelicense
- Mark as Read
- Mark as New
- Bookmark
- Permalink
- Report to a Moderator
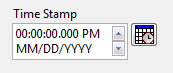
Another trick is to color parts of the Classic Time Stamp transparent and put a system numeric behind it. Caveats: It won't resize well, even with the two controls grouped, and it might have problems with the inc/dec buttons not lining up when the system theme changes. I attached an example to the original document (Fake System Time Stamp.vi).
Christina Rogers
Principal Product Owner, LabVIEW R&D
- Mark as Read
- Mark as New
- Bookmark
- Permalink
- Report to a Moderator
Hello ChristinaR,
It is a trick, but it is a good one ;-).
Is it possible for not NI Employees to create "Missing System Controls"? How?
- Mark as Read
- Mark as New
- Bookmark
- Permalink
- Report to a Moderator
Yes, it is possible for people outside NI to make controls like the ones here. The Control Editor lets you make cosmetic changes to controls. However, there are limits, when "faking" system controls, to how well we can get them to behave on different system themes. I've never been comfortable shipping these "fake" system controls in the palette, because of these limitations.
If you're coming to NIWeek 2011, Simon and I are presenting "Customizing NI LabVIEW Controls and Indicators" where we'll show how we make controls like these.
Christina Rogers
Principal Product Owner, LabVIEW R&D
- Mark as Read
- Mark as New
- Bookmark
- Permalink
- Report to a Moderator
I attempted to update the graph legends in the attached "Missing System Graphs 1.vi." Please let me know if you find problems with them. I'll ask Simon to review them and maybe make a new revision of the entire package.
Christina Rogers
Principal Product Owner, LabVIEW R&D
- Mark as Read
- Mark as New
- Bookmark
- Permalink
- Report to a Moderator
Beautiful work everyone, I use these controls alot in my apps.
Just one question, is there any way to update the style of a system style array index to match the array.
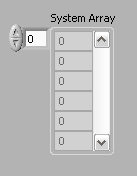 The array looks great, the displayed index spoils it.
PS. I know I can hide it, but sometimes I need it.
- Mark as Read
- Mark as New
- Bookmark
- Permalink
- Report to a Moderator
Hi Christina,
Perhaps you can share with us (those who cannot make it to NI Week this year) your slides after you and Simon have presented?
- Mark as Read
- Mark as New
- Bookmark
- Permalink
- Report to a Moderator
Hi ChristinaR,
Thank you a lot! Your adaptions look great.
I am from Germany so I can unfortunately not see you at NI week. I would like to see your presentation in the Internet too.
I tried to import your SystemStyle Pictures from the Graph Palette into the Pictures of a Modern Style XY Graph Palette and I works. So I can also create a Graph with visible Graph Palette and without the surrounding border. By the way I think the small green LED in the pictures of these Buttons overloads the pictures and they are unnessasary.
The only think I found is that the On-State of the buttons in the Graph Palette does not seem to be a system style Picture?
But maybe I can create systemstyle pictures by myself after learning from your presentation 😉
Thank you for the quick and competent help!
- Mark as Read
- Mark as New
- Bookmark
- Permalink
- Report to a Moderator
It would be great to have also the mixed signal system control, that is the only one that is actually missing.
By the way, thanks for the great job!
- Mark as Read
- Mark as New
- Bookmark
- Permalink
- Report to a Moderator
Our presentation is more demos than slides; I'll ask Simon if we can make an online version of it.
I'll take a look at the other control requests and reply separately for each.
Christina Rogers
Principal Product Owner, LabVIEW R&D
- Mark as Read
- Mark as New
- Bookmark
- Permalink
- Report to a Moderator
I'm not sure if these are the LEDs you were referring to, but I made "Missing System Graphs 2.vi" which has the Scale Format buttons a little bigger so the green lights aren't on top of the scale icons.
It turns out I can't make the buttons in the Graph palette be the system style, because they're not actually buttons. Maybe we could change that in a future version.
Christina Rogers
Principal Product Owner, LabVIEW R&D
- Mark as Read
- Mark as New
- Bookmark
- Permalink
- Report to a Moderator
You can edit the index part of an array by switching to Customize mode in the Control Editor, selecting the index, and using Edit>>Customize Control to open the index in a separate Control Editor. I attached "Missing System Array 1.vi" to illustrate the results.
Christina Rogers
Principal Product Owner, LabVIEW R&D
- Mark as Read
- Mark as New
- Bookmark
- Permalink
- Report to a Moderator
I attempted to make a System Mixed Signal Graph ("System Mixed Signal Graph.ctl"). Let me know if it has any problems.
Christina Rogers
Principal Product Owner, LabVIEW R&D
- Mark as Read
- Mark as New
- Bookmark
- Permalink
- Report to a Moderator
I've pondered what a System style color box would look like, and I haven't come up with anything better than the Color Box in the Classic Numeric palette (i.e. a color box with no frame). If that doesn't seem like it would work for you, please let me know what you think it should look like.
Christina Rogers
Principal Product Owner, LabVIEW R&D
- Mark as Read
- Mark as New
- Bookmark
- Permalink
- Report to a Moderator
The graph "helpfully" preserves its colors when you use right-click Replace, so the behavior you're seeing where the parts "revert" to Modern style is not a bug. Simon just colored those parts transparent, and the right-click Replace is coloring them to the original graph's colors. In cases like this, it's better to use paste-replace. (You can read more about paste-replace on my blog).
Christina Rogers
Principal Product Owner, LabVIEW R&D
- Mark as Read
- Mark as New
- Bookmark
- Permalink
- Report to a Moderator
Ahhhhhhh... So that's how you do it. I've been trying for ages to do that. And a couple of the controls in the 'missing' graph needed updating too (which you've kindly already updated).
That's fantastic. Thank you.
- Mark as Read
- Mark as New
- Bookmark
- Permalink
- Report to a Moderator
You're all welcome! Glad I could help!
Christina Rogers
Principal Product Owner, LabVIEW R&D
- Mark as Read
- Mark as New
- Bookmark
- Permalink
- Report to a Moderator
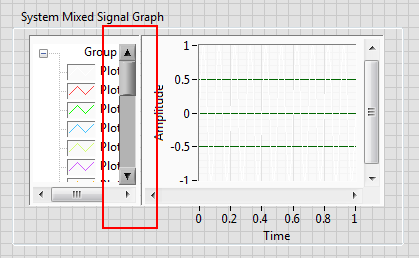
I found a cosmetic bug in the System Mixed Signal Graph: when you add a lot of plots to the same plot area, the vertical scrollbar shown in the legend area doesn't confrom to system colors and theme
-------------------------------------------
In claris non fit interpretatio
-------------------------------------------
Using LV from 7
Using LW/CVI from 6.0
- Mark as Read
- Mark as New
- Bookmark
- Permalink
- Report to a Moderator
Two more comments on the system mixed signal graph.
1st problem
The first plot is white by default (and therefore is invisible given the white plot background)
2nd problem
when you drag and drop the plot from one area to another the primary y scale grid becomes green
both the problems are evidenced in the image attached by vix

Christina can you help us?
- Mark as Read
- Mark as New
- Bookmark
- Permalink
- Report to a Moderator
Unfortunately, I'm on a deadline, so it'll be a few days before I can try to edit the control. I think the scrollbar problem is because tree control that we use for the legend is a "Modern" style, so it has the wrong scrollbar. I'm not sure if we can replace it with a "System" tree. If anyone is particularly skilled with nested Control Editors, go ahead and try it and let me know.
You can change the first plot color easily enough, but I don't think you can change the new plot colors, so I think white would come up again every 10 plots or so.
I have no idea what's going on with the scale grid changing color. That might be a bug. I'll have to talk to my teammates to find out if there's some reason why it's supposed to change color (and, if so, how we define the new color).
Christina Rogers
Principal Product Owner, LabVIEW R&D
- Mark as Read
- Mark as New
- Bookmark
- Permalink
- Report to a Moderator
ChristinaR wrote: Unfortunately, I'm on a deadline, so it'll be a few days before I can try to edit the control. I think the scrollbar problem is because tree control that we use for the legend is a "Modern" style, so it has the wrong scrollbar. I'm not sure if we can replace it with a "System" tree. If anyone is particularly skilled with nested Control Editors, go ahead and try it and let me know
It' quite easy to replace a "Modern" tree with a "System" one, but how to have the plot legends inside the tree? I think the one in the Mixed Signal Graph it's not a simple tree...
-------------------------------------------
In claris non fit interpretatio
-------------------------------------------
Using LV from 7
Using LW/CVI from 6.0
- Mark as Read
- Mark as New
- Bookmark
- Permalink
- Report to a Moderator
You are correct - I just tried replacing the tree part and the graph legend no longer works correctly. My guess is that the tree has attributes that are not being preserved by the Control Editor. So this is probably something I would need to make changes to the LabVIEW EXE to accomplish, and not something I can do in the current version. Sorry!
Christina Rogers
Principal Product Owner, LabVIEW R&D
- Mark as Read
- Mark as New
- Bookmark
- Permalink
- Report to a Moderator
ChristinaR wrote:
So this is probably something I would need to make changes to the LabVIEW EXE to accomplish, and not something I can do in the current version. Sorry!
This is not what I'd like to hear 
I think that the Mixed Signal Graph (MSG) is a really powerful control, but it needs some bug-fixing. I don't know why, but several issues has been reported in the NI forum (and in the LAVA one) but never considered and fixed.
I can spent some time and create a new forum discussion with all these issue, if you can assure me that in the next LabVIEW release they'll be fixed and the MSG control will be improved.
-------------------------------------------
In claris non fit interpretatio
-------------------------------------------
Using LV from 7
Using LW/CVI from 6.0
- Mark as Read
- Mark as New
- Bookmark
- Permalink
- Report to a Moderator
There have been some improvements in the MSG for the next release, but the best way to make sure we address all your issues is to make sure they are all reported. Any posts that mention a CAR number have already been entered in our bug-tracking system. I encourage you to post about any others you have seen, and to highlight any that cause you significant hardship, so we can prioritize them. (I can't make any promises about specific fixes, but I'll make sure someone reviews your list and we'll make every effort to address them in the next version).
Christina Rogers
Principal Product Owner, LabVIEW R&D
- Mark as Read
- Mark as New
- Bookmark
- Permalink
- Report to a Moderator
I encourage you to post about any others you have seen, and to highlight any that cause you significant hardship, so we can prioritize them. (I can't make any promises about specific fixes, but I'll make sure someone reviews your list and we'll make every effort to address them in the next version).
see here
-------------------------------------------
In claris non fit interpretatio
-------------------------------------------
Using LV from 7
Using LW/CVI from 6.0
- Mark as Read
- Mark as New
- Bookmark
- Permalink
- Report to a Moderator
Thanks for sharing! Excellent job! Thank you!
- Mark as Read
- Mark as New
- Bookmark
- Permalink
- Report to a Moderator
The plot legend scollbar is not really useable in my opinion, because you can not progammable set the first visible plot ...
So the first visible plot can be the 10th and you currently have only 2, so the user see an "empty" plot legend.
- Mark as Read
- Mark as New
- Bookmark
- Permalink
- Report to a Moderator
Brilliant !! Thank you for sharing.
But.... when I try to run "Missing System Controls Installer.vi" and to add the controls to my LabVIEW 7, I find that it only copy ctl files to LabVIEW 7 folder, not making them version 7.0.
I am still using LabVIEW 7 Express.
So.....could any one please help making the ctl files LabVIEW version 7.0?
Thanks~
- Mark as Read
- Mark as New
- Bookmark
- Permalink
- Report to a Moderator
Good
- Mark as Read
- Mark as New
- Bookmark
- Permalink
- Report to a Moderator
Hi Folks -
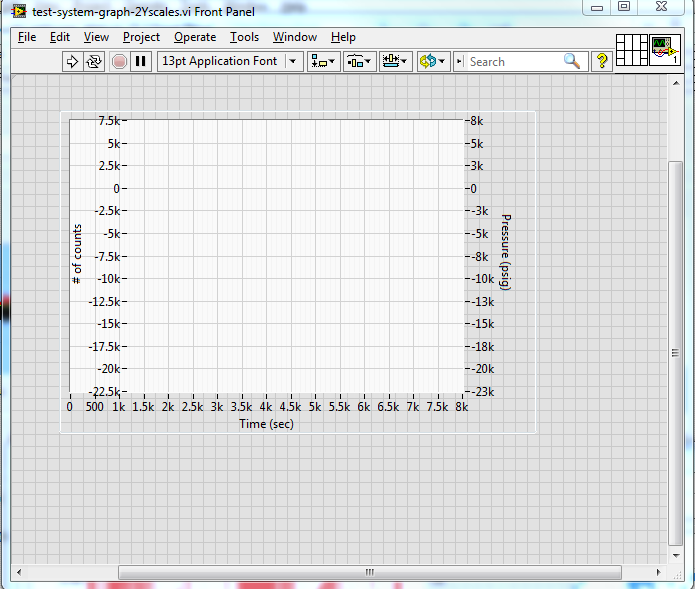
I am using a waveform graph from this palette. I added a second Y-scale. The first Y-scale needs now to be moved to the left of the X-axis 0 (so not inside the plot) like we normally see, but I can't seem to find a way to resize the graph or otherwise move it so that it is not inside the plot. Any help here is appreciated. I am thinking it is something obvious.
I don't seem to be able to attach the VI, so I am adding a screenshot and can send the graph via email for anyone to take a look at.
Sincerely,
Don
- Mark as Read
- Mark as New
- Bookmark
- Permalink
- Report to a Moderator
Select the graph. Choose the Edit menu and select Customize Control. A Control Editor window pops up. Choose the Operate menu and select Change to Customize Mode. You should now be able to select the plot are and resize it. When done, close the Control Editor window and select "Yes" to Replace the original control in the first dialog and "Don't Save" in the second dialog.
BTW, can you tell me how you added the second Y-scale? When I choose Duplicate Scale and Swap Sides, the scales are properly outside the plot area. Thanks.
Christina Rogers
Principal Product Owner, LabVIEW R&D
- Mark as Read
- Mark as New
- Bookmark
- Permalink
- Report to a Moderator
Thanks for your reply. I did the normal duplicate scales, but I think what messed this up was that In my LabVIEW.ini file, I have the setting: "EnableAutoScales=False" which I have placed there to keep the plots from resizing themselves. Swap sides was grayed out so I had to change the ini setting to "EnableAutoScales=True" to ungray the option for Swap Sides. How did I stumble across this?
See http://forums.ni.com/t5/LabVIEW/Multiples-scales-swap-sides-problem-LV8-5/td-p/1030537/page/2
I am thinking that the initial scale showing up on the interior might not have happened if I had "EnableAutoScales=True" set from the start. I just tested and verified this so thanks for bringing that to light.
Should be all set now.
Sincerely,
Don
- Mark as Read
- Mark as New
- Bookmark
- Permalink
- Report to a Moderator
Sweet!
Hassan Atassi
Senior Group Manager, Digital Support
- Mark as Read
- Mark as New
- Bookmark
- Permalink
- Report to a Moderator
This palette is a nice step up from what we are used to when mixing system and modern controls.
I have one question though. When using a decal icon on the system button, the icon does not move when activating the button - which does not look right since the button text moves.
In this link a much more complicated approach is presented which has the moving icon:
This is however hard to do since it requires LV 7.1 in order to create the button (the first one at least, from there on you can just edit that button).
Do you have another approach where a similar effect could be obtained without the use of a very old labview version?
- Mark as Read
- Mark as New
- Bookmark
- Permalink
- Report to a Moderator
ARGH! The YouTube video is down and I need to make some custom buttons for my application today! Any chance there's an alternate host or a written tutorial I can read?
- Mark as Read
- Mark as New
- Bookmark
- Permalink
- Report to a Moderator
The video works for me. You may be in a location that blocks YouTube.
It's not hard to make a custom button.
- Find the image you want (probably a PNG).
- Edit>>Import Image to Clipboard.
- Customize a button. (Select it and select Edit>>Customize Control)
- Right-click and Import Picture from Clipboard>>Decal.
Christina Rogers
Principal Product Owner, LabVIEW R&D
- Mark as Read
- Mark as New
- Bookmark
- Permalink
- Report to a Moderator
Thanks, Christina. I'm definitely not in a place that blocks YouTube (shared office space), but I'll check with the admins anyway. Can you tell me how to
1. Get the decal to "move" with the button when I click it? (There's a subtle shift in position when you click a button, but the decal stays in place.)
2. Import a vector graphic so the decal scales without aliasing when I resize the button?
- Mark as Read
- Mark as New
- Bookmark
- Permalink
- Report to a Moderator
Neither of those are officially supported capabilities.
JKI figured out a trick to getting a decal to move with the button: http://forums.jki.net/topic/490-creating-system-dialog-buttons-with-custom-icons-and-mouse-hover-eff...
The vector graphic discussion is too complicated to go into here, but generally LabVIEW just doesn't support them.
Christina Rogers
Principal Product Owner, LabVIEW R&D
- Mark as Read
- Mark as New
- Bookmark
- Permalink
- Report to a Moderator
Oh. That's disappointing, but thanks for the reply.
- Mark as Read
- Mark as New
- Bookmark
- Permalink
- Report to a Moderator
I unzip it to Labview 2012, it seems work ,Good !!!! and thanks!
- Mark as Read
- Mark as New
- Bookmark
- Permalink
- Report to a Moderator
Very good addition to GUI design, but there are three disappointing things:
- Some controls are not reworked completly (e.g. index display of array shell)
- Some controls are missing, e.g. tables
- Symbols of buttons do not resize with the button
Overall still very good.
Norbert
- Mark as Read
- Mark as New
- Bookmark
- Permalink
- Report to a Moderator
Norbert,
- True. I created this as a side project rather than an NI sanctioned development effort -- I implemented what I use and shared. Since I don't like leaving the index display of arrays visibile (I much prefer scroll bars) I chose not to do certain things. Feel free to make whatever improvements you want and post the results. As you can see Christina has added some better graphs and other controls.
- This was designed to supplemental to the existing System palette on Windows. Table is in the regular System palette. Althought I'm sure there are controls that aren't in either (i.e. IMAQ, since I don't use Vision very often).
- Correct. This is a limitation of using bitmaps and how LabVIEW scales buttons. For the most part I (and Microsoft's experts) recommend keeping buttons a consistent size.
Simon
- Mark as Read
- Mark as New
- Bookmark
- Permalink
- Report to a Moderator
Norbert_B wrote:
3. Symbols of buttons do not resize with the button
Just FYI, the symbols on the buttons are graphic images. LV can't treat graphics as vectors, so allowing them to resize with the control would result in heinous aliasing in the images.
- Mark as Read
- Mark as New
- Bookmark
- Permalink
- Report to a Moderator
Thank you for your effort,well done
- Mark as Read
- Mark as New
- Bookmark
- Permalink
- Report to a Moderator
I love this suite, but I always find that I'm looking for a windows 7-style timestamp control, and the XP-style one made by PhillipBrooks just doesn't cut it (and I don't like the "Fake Timestamp Control" seen above, mostly because it can't be stored in the palettes and the user doesn't actually interact with the increment/decrement buttons, which I think looks a little bit awkward)
I made my own Windows 7 timestamp control and posted it here just in case there are other people like me out there.
- Mark as Read
- Mark as New
- Bookmark
- Permalink
- Report to a Moderator
I am a LabView beginner and love these !! Thanks for that.
There is one I am missing and that's the System Numeric Indicator. How can I create a nice indicator just like the Numeric input?
(Side note: LabView really could use a design update... the days of Windows 2000 are well behind us now. )
- Mark as Read
- Mark as New
- Bookmark
- Permalink
- Report to a Moderator
Hi Carl,
just use the SystemNumericControl and switch it to Indicator…
GerdW
using LV2016/2019/2021 on Win10/11+cRIO, TestStand2016/2019
- Mark as Read
- Mark as New
- Bookmark
- Permalink
- Report to a Moderator
Thank you very much.
Now you see that I am a beginner. Had no idea you could just easily switch.
- Mark as Read
- Mark as New
- Bookmark
- Permalink
- Report to a Moderator
Very Great Creativity Thumbs up!
Thank you & Best regards
syrpimp
=======================================================
“You must continue to gain expertise, but avoid thinking like an expert." -Denis Waitley
- Mark as Read
- Mark as New
- Bookmark
- Permalink
- Report to a Moderator
Hey Guys,
Boring question, I can't find any licensing information on this. I'm guessing it will be the NI Sample Code License but it could do with attaching so I can back myself up if a customer asks!
========
CLA and cRIO Fanatic
My writings on LabVIEW Development are at devs.wiresmithtech.com
- Mark as Read
- Mark as New
- Bookmark
- Permalink
- Report to a Moderator
On VIPM there is a package called "UI Control Suite: Systems Controls 2.0" which is published by NI
From what I can tell, it is a redistro of the "missing controls"
- Cheers, Ed
